Reference

Limits and performance

What the app handles and how fast, measured on a real Jira Cloud site. Narrow the filter when a plan reaches a limit; the chart tells you when it does.

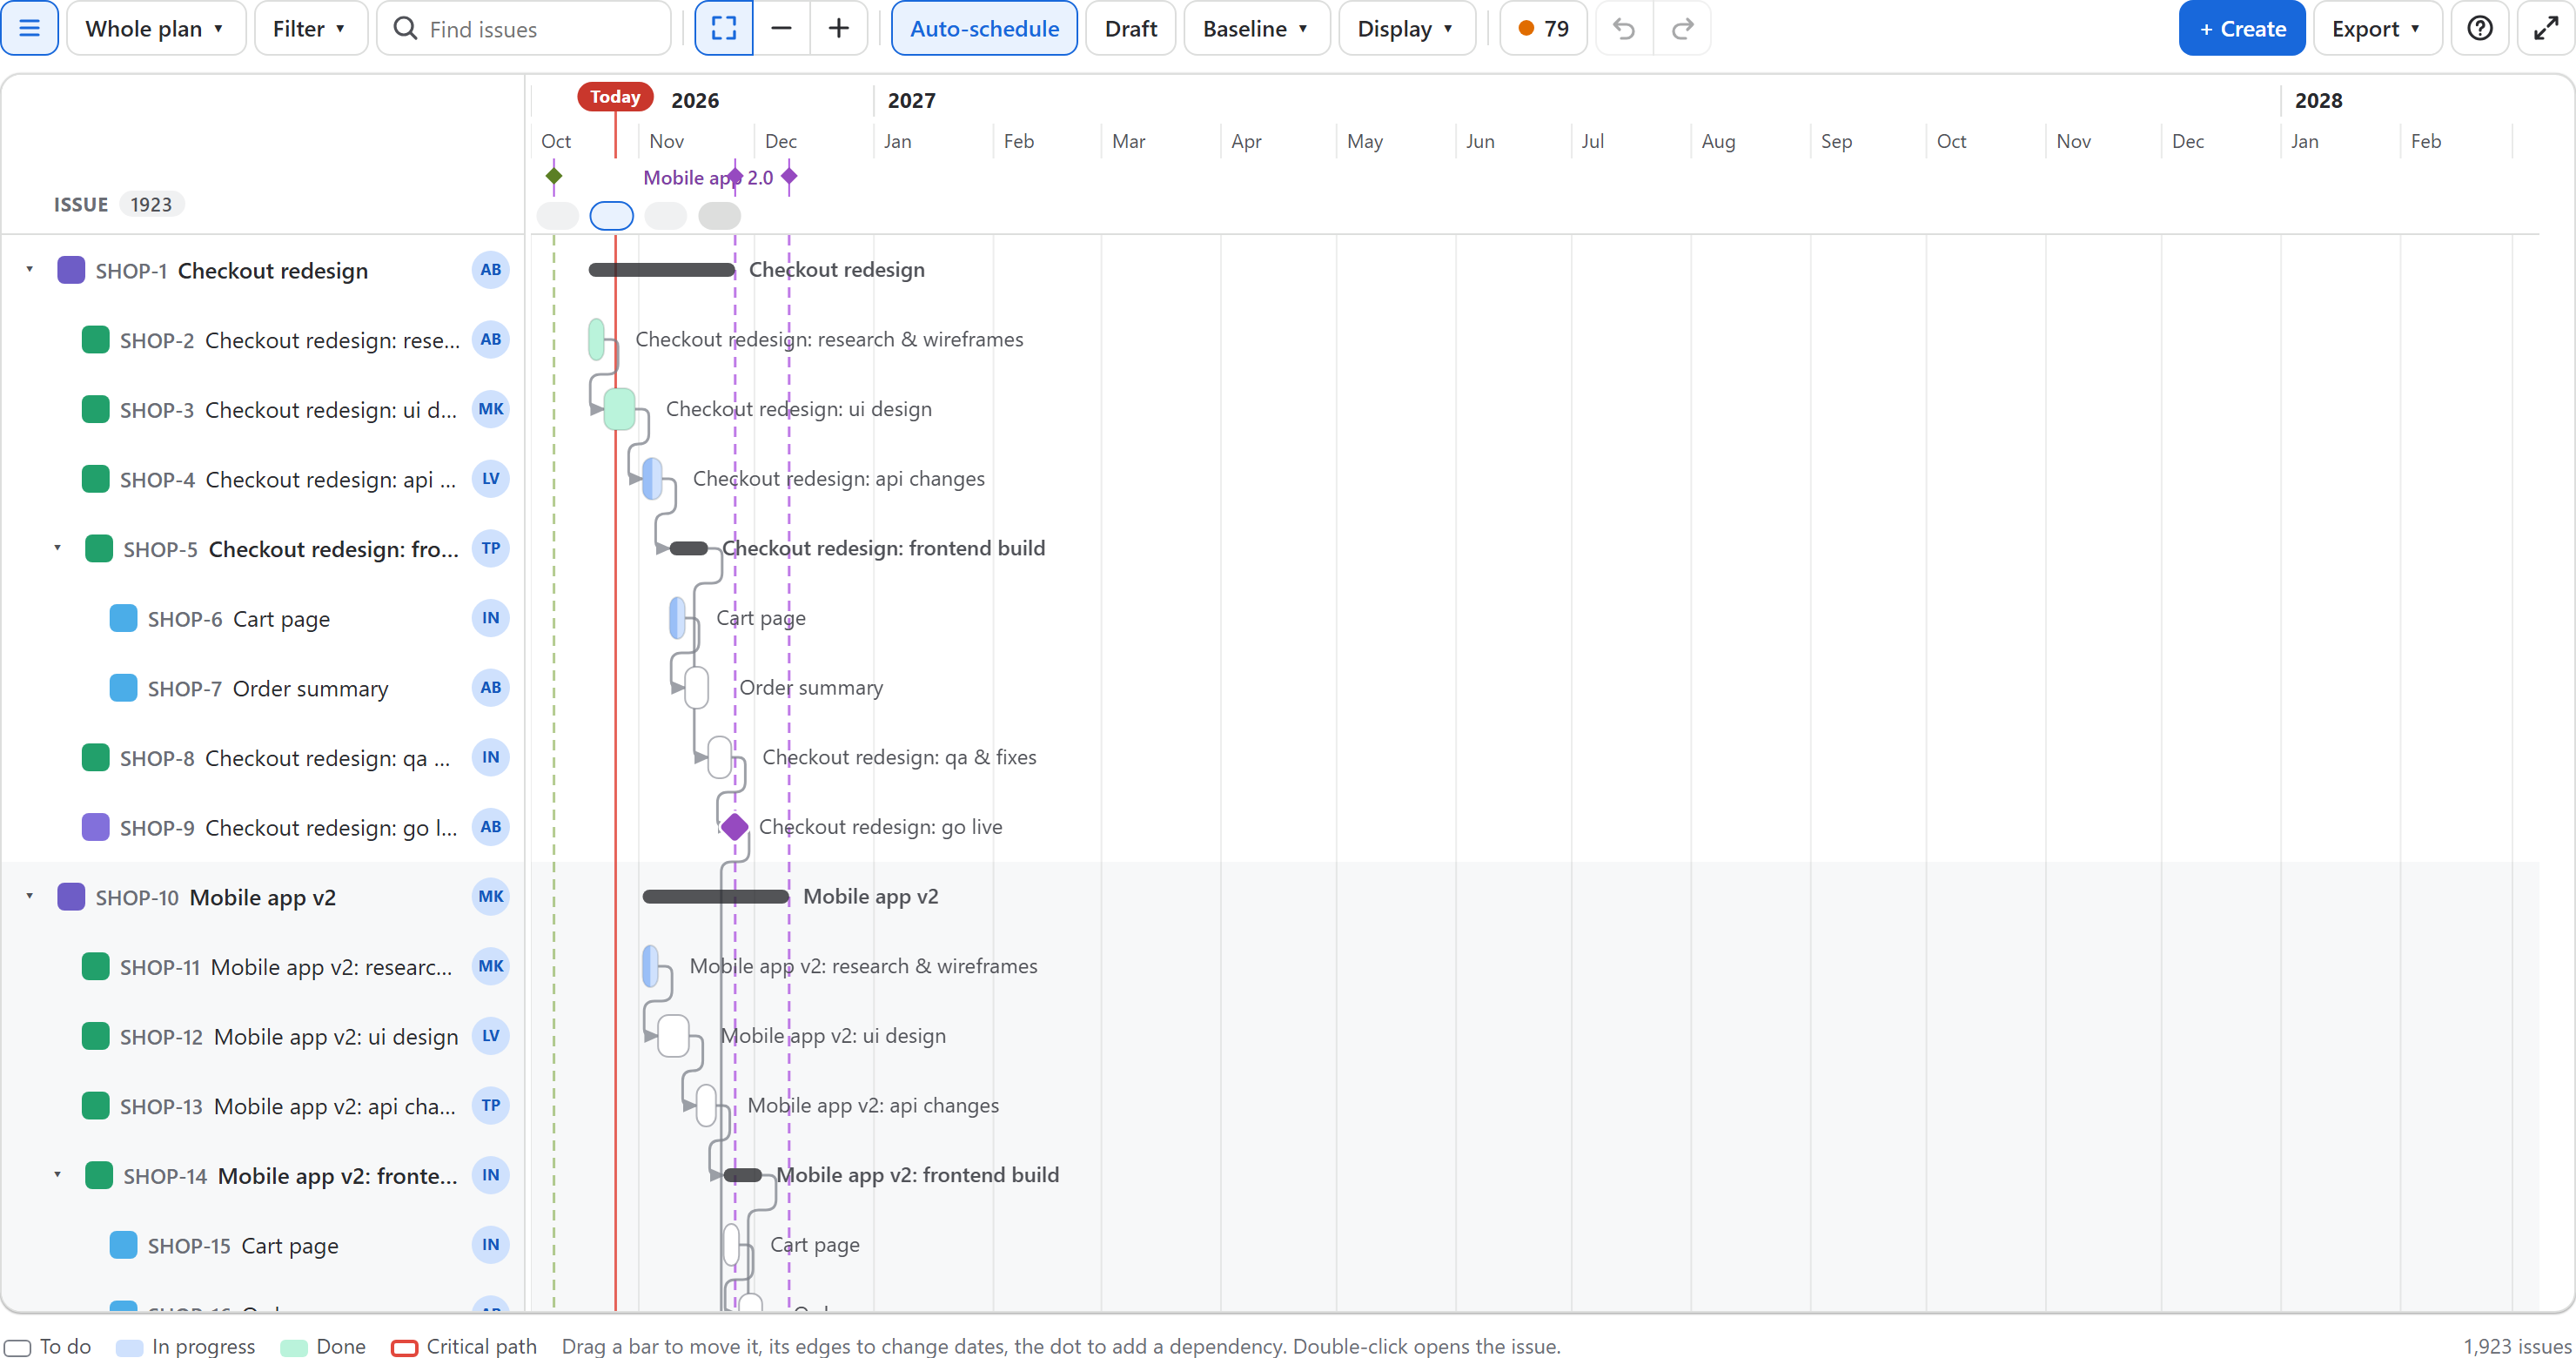
A plan of 1,923 issues over sixteen months: the whole plan zoomed out, epics with their stories and subtasks, dependency arrows, releases and sprints
1,923 issues in one plan, zoomed out to the whole of it; only the rows on screen are drawn.

Plans

Limit or figure
Issues in one plan10,000 (the chart says when a filter finds more)
Loading 1,000 issuesAbout 5 seconds after the page opens
Loading 10,000 issuesAbout 10 to 15 seconds; a bar shows how much has arrived
ScrollingSmooth with 10,000 issues: only the rows on screen are drawn
JQL filter2,000 characters
RefreshWhen you come back to the tab after a minute away; the dashboard gadget every 15 minutes

Saved things

Limit
Views per project (and on the Gantt page under Apps)30
Baselines per project20
Issues in a baseline10,000
Holidays in the working calendar500
Dependency link types20
Milestone issue types10

Changes

Limit
Undo historyThe last 50 steps, until you leave the page
Lag of a dependency−365 to +365 working days
Issue name255 characters
Import from MS Project2,000 tasks per file
Exported image (PNG, SVG)1,000 rows
Dashboard gadget height240 to 900 pixels

Rovo agent

Limit
Issues looked at for one answer2,000
Issues in a drafted plan30
Issues listed per point in an answer15

Large moves are saved in parts and a busy Jira is retried, so a cascade of a hundred issues still finishes with an answer per issue. If something stops part-way, the chart reads back what Jira saved; see Troubleshooting.